Data Science? Data Analysis?
As more and more attention is paid on data, a mixture of new and existing terminologies is creating confusion even among experts in the field. The fact that there is no authoritative definition about each term is aggravating the situation. One of the prime examples is the distinction between data science and data analysis, which everyone seems to have his or her own version of explanation. The only way to wade through this madness is to establish your own version of truth.
Under this background, Softline sees data science and data analysis as below.
Under this background, Softline sees data science and data analysis as below.
1. Data science : A series of activities to develop business solution from problem defining, hypothesizing, modeling, visualization, to deployment.
2. Data analysis : An activity to draw insight from data that has narrower concept than data science.
Types of Data Analysis
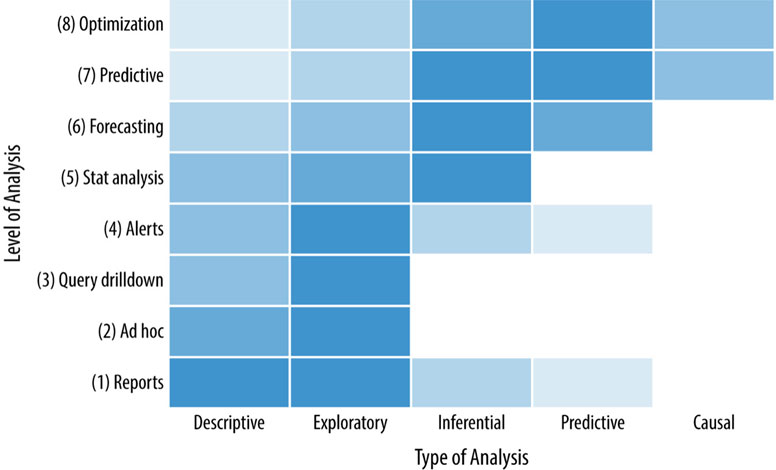
Data analysis, a core part of data science, can be categorized into several depending on target data or purpose. The former is a technical categorization which encompasses geospatial, time-series, graph, text, image, etc. And the latter is more suitable for understanding the nature of data analysis.
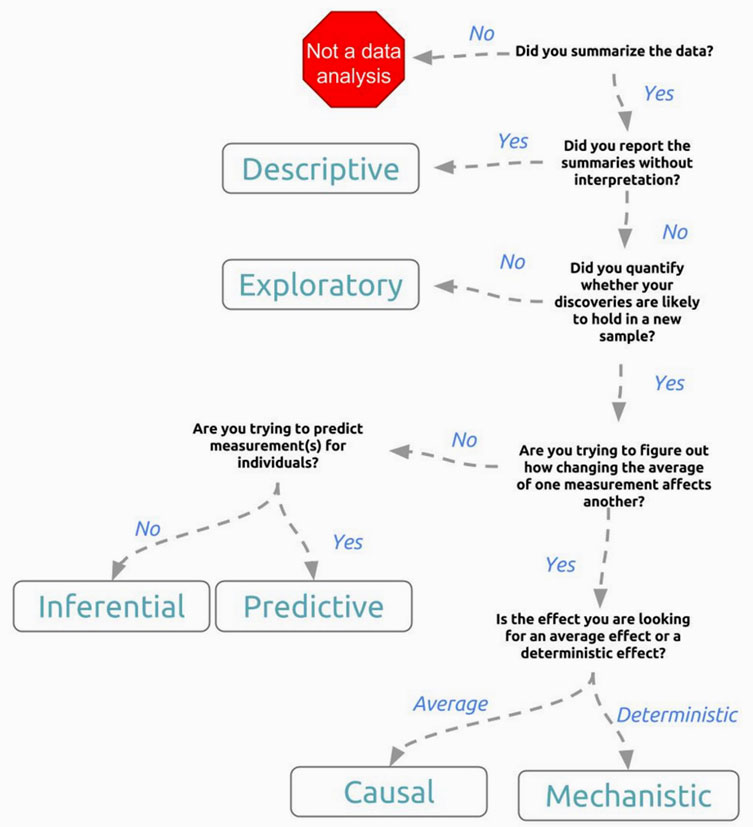
Although multiple versions of categorization exist, we believe the six categories suggested by Jeff Leek of Johns Hopkins University.
Although multiple versions of categorization exist, we believe the six categories suggested by Jeff Leek of Johns Hopkins University.
1. Descriptive : Profile the data to understand the data using statistical measures such as average, standard deviation, etc.
2. Exploratory : Explore the data to identify correlation among variables.
3. Inferential : Statistically infer whether correlations found in the sample can be applied to the general population.
4. Predictive : Create models out of generalizable patterns within sample data that can predict the value of target variable taking a series of predictor variables as input.
5. Causal : Search for causality among identified correlations.
6. Mechanistic : Check whether identified causality holds in call cases.
Requirements of Data Analysis
For any organization to see positive outcome from data analysis, data engineering must efficiently store and distribute data securely. But that is only part of the picture. The missing piece is high-performance computing platform.
The nature of data analysis from execution perspective is mathematical and statistical calculation on massive data. The calculation ranges from simple summary statistics to complicated machine learning algorithms, and they are performed iteratively and repeatedly. If the time for one calculation takes longer, the time for the analysis will get longer by the times of iteration. Data analysts often suffers from heavy job lasted over-night only to fail due to insufficient memory. So the higher demand for data analysis gets, the higher demand for performant computation. At the same time, it tells why one of the 3Vs of Big Data is velocity.
Analytics calculation has two characteristics.
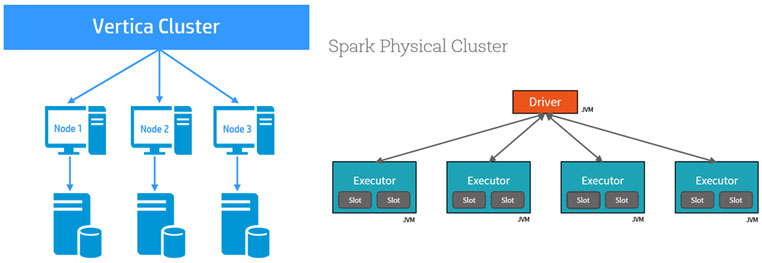
All in all, analytic calculation is relatively simple computation run on massive data iteratively. And parallel architecture shows better performance for this type of workload. It means for analytic calculation ten high-schoolers who know calculus are better suited than one Harvard PhD in applied mathematics. If each person is computer, it means a cluster of multiple entry-level servers shows better performance than one high-end server. If each person is a core of a processor, it means a GPU which is usually consisted of thousands of low speed cores is better than a CPU which has tens or twenties of high speed cores. MPP (Massive Parallel Processing) is the architecture that embraces this idea. This is why almost all machine learning and analytics platforms are based on MPP architecture.
The nature of data analysis from execution perspective is mathematical and statistical calculation on massive data. The calculation ranges from simple summary statistics to complicated machine learning algorithms, and they are performed iteratively and repeatedly. If the time for one calculation takes longer, the time for the analysis will get longer by the times of iteration. Data analysts often suffers from heavy job lasted over-night only to fail due to insufficient memory. So the higher demand for data analysis gets, the higher demand for performant computation. At the same time, it tells why one of the 3Vs of Big Data is velocity.
Analytics calculation has two characteristics.
1. Massive Data : Size of target data is huge.
2. Simple and Iterative : Relatively simple calculation done repeatedly.
2. Simple and Iterative : Relatively simple calculation done repeatedly.
All in all, analytic calculation is relatively simple computation run on massive data iteratively. And parallel architecture shows better performance for this type of workload. It means for analytic calculation ten high-schoolers who know calculus are better suited than one Harvard PhD in applied mathematics. If each person is computer, it means a cluster of multiple entry-level servers shows better performance than one high-end server. If each person is a core of a processor, it means a GPU which is usually consisted of thousands of low speed cores is better than a CPU which has tens or twenties of high speed cores. MPP (Massive Parallel Processing) is the architecture that embraces this idea. This is why almost all machine learning and analytics platforms are based on MPP architecture.